Have you ever thought about making presentations that are accessible to everyone but don’t know where to start? Are you organizing a conference and care about making presentations more accessible but don’t know what to ask for? The winners of the accessibility awards at useR! 2021 shared their experience preparing accessible presentations for the first time. Check out this blog post and the complete interview to find out more!
Some context
An important element to make useR! 2021 a conference for everyone was providing materials accessible for participants with sensory disabilities. To achieve this goal, we produced accessibility guidelines for each of the conference formats, created a xaringan theme for slides, and wrote a blog post with tips for making the presentations. We also set up a dedicated email for accessibility questions and doubts (accessibility@user2021.ch) and a dedicated channel in the conference chat platform, where an accessibility helper was present in case anyone had trouble getting the links or the material.
In the closing ceremony, we implemented Accessibility awards to recognize the work that the presenters put into following the accessibility guidelines. A small committee checked the slides for aspects such as file formats, ease of reading and navigating, and the presence and quality of alt-text in the figures. After a careful review, the awarded presentations were:
- Natalia Morandeira: Obtaining reproducible reports on satellite hotspot data during a wildfire disaster - https://nmorandeira.github.io/Fires_ParanaRiverDelta/
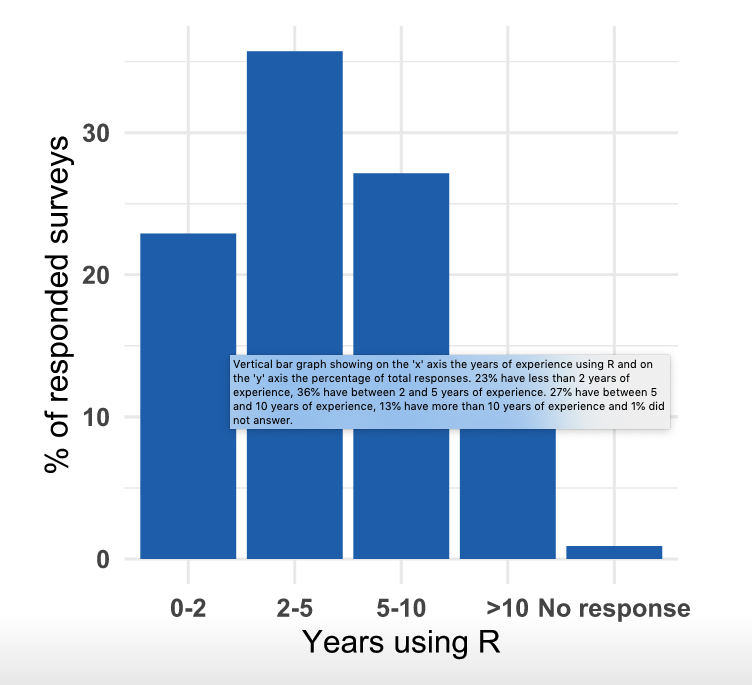
- Virginia Alonso and colleagues: Using R in Latin America: the great, the good, the bad, and the ugly https://encuesta-user2021-en.netlify.app/
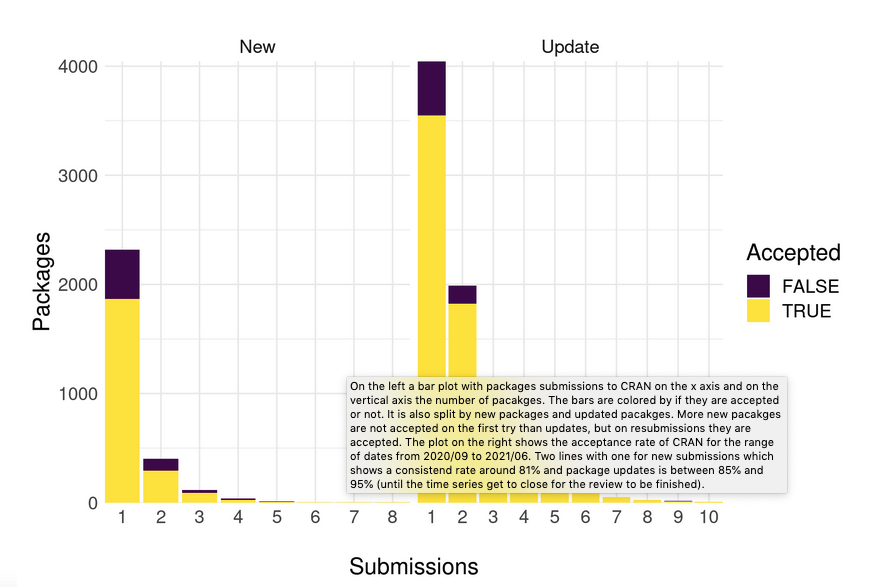
- Lluís Revilla: Packages submission and reviews; how does it work? https://user2021.llrs.dev/
We talked to the authors of these presentations and asked them about their motivation, learning process, and tips for other community members who want to make more accessible material but don’t know where to start.
In the following lines, we highlight some key messages from the conversation. The link to the interview is here.
Clear communication from the organizers regarding accessibility was key
All of our interviewees mentioned that the emphasis on accessibility by the useR! 2021 organization team motivated them to make accessible presentations for the first time. The publication of guidelines with concrete expectations, advice, and additional references was a good starting point for all of them.
As conference organizers, it was essential for us to know that the guidelines were helpful to the presenters. If you are planning an event and want to introduce a more inclusive practice, let everyone know about your goals and take steps to support them. It is important to publicize this because some of these good practices are not (yet) as mainstream as they should be, and presenters may need more information. Additionally, potential disabled attendees will know that the organization is taking care of this and who to contact.
Put yourself in someone else’s shoes
Experiencing barriers for participation in conferences (and academia) due to not being native English speakers and–for some of them–being from low-income countries were factors that made the awardees more sensitive to forms of exclusion that people may experience. Virginia, Paola, and Natalia also mentioned that participating in groups like R-Ladies and Latin-R that foster inclusion in the R community has made them more aware of other barriers for inclusion and willing to help overcome them.
R Markdown is a good start
As part of their workflow, Natalia, Lluís, Virginia, Paola, and their colleagues learned to make slides using R Markdown and package xaringan. There is a lot of online material that covers creating slides in R Markdown and xaringan. The great news is that if you are already interested in learning R Markdown or already know R Markdown and you want to improve the accessibility of your materials, you are halfway there!
The output created by R Markdown consists of HTML slides that are screen-reader friendly and navigable. Using a code-hosting service like GitHub or Gitlab, the slide decks can be easily published as a webpage. Having a link to the slides to make them available beforehand is extremely important for people who use screen readers because it allows them to follow the presentation as it happens.
Recently, R Markdown added the option to add alt-text to code chunks (using option fig.alt =). As Natalia and Lluís pointed out, good alt-text is essential. “Figure1.png” is not good alt-text as the type of plot, the information in axes, and the relationship between variables should be clear in the text. Check some examples of good, informative alt-text by hovering your mouse over the figures in their slides. The text that appears is readable by screen readers.
Virginia’s and Pao’s: https://encuesta-user2021-en.netlify.app/#7

Lluís: https://user2021.llrs.dev/#14

It takes a village
We also talked about the importance of reaching out to the community for feedback. Natalia, Virginia, and Paola mentioned the #clinicadecharlas (“talk clinic”) channel in the LatinR Slack workspace as a great place to give and receive feedback, not only about the accessibility of their slides but about their conference abstracts too. Lluís mentioned looking for feedback on social networks and from key people in the community—for example, Stephanie Butland, the community manager for rOpenSci–, and even from his family. He also wrote to the useR! 2021 dedicated email account for accessibility, accessibility@user2021.ch inquiring about some of our requirements.
Some final advice
Lluís pointed out that building an accessible presentation is a gradual process, so don’t be discouraged if your first drafts are imperfect. Build your skills doing presentations step by step and improving pre-existent slide decks. Practice writing good alt-text. As Natalia said, “what is challenging and may seem like a lot of work for the person who is preparing the presentation is what makes inclusion possible”. So keep trying. Your effort is worth it. Finally, spread the word of accessibility in presentations as it is a significant first step towards inclusion and should become a common standard in conferences.
Links
To join the LatinR slack click here
Liz and Silvia’s talk about writing alt-text for data visualization:
Chartability is a website with data visualization accessibility resources and documentation for auditing your work for accessibility

